
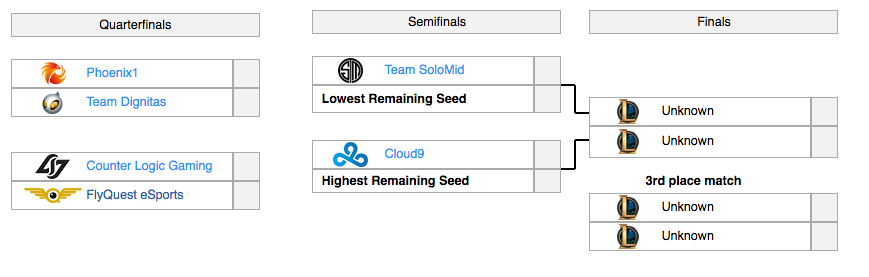
The schedule and teams
However, simulating a tournament is not as easy as flipping a coin for each match up. The data generated needs to have weight; it needs to be significant, and most importantly needs to model real life. In order to give weight to my simulations I needed to determine which team was going to win each match up probabilistically.In theory, in any match up the team with the higher skill should beat the team with the lower skill more times than not. The best way to quantify this is to calculate an elo, which ideally represents a team’s skill. Elo is used in many online multiplayer games to determine a player’s skill. Elo originated in the chess scene. Named after the creator, Arpad Elo, Elo was used to determine the top players based on who they competed against. Elo has been expanded to many other sports and games. Most notably, Nate Silver and his team at 538 have been using elo for all types of sports. The have built elo models for football and basketball as well as baseball. However, you need match history and other data to build an accurate elo for a team or player.I scraped two years of professional game results, around 700 games. Each team in those two years started with an elo of 1500. As teams competed against each other, elo fell rose, and stabilized. The method for calculating elo is easy the formula is quite straight forward (check out this tutorial here). You need a few things to calculate elo: the rating of both teams before the match, the outcome of the match, and a “k factor”.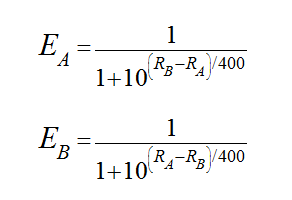
Formulas for calculating Elo ratings
Ratings and Outcomes are handled by the data and the equations above, however, the “K factor” must be estimated. I tried out a few k factors to determine which provided the most stable, but reactive elos and settled on a value of 20. I looked to a lot of Nate Silver/538 to see if they had any inside. I highly suggest reading how they calculate their elo values as the insight was invaluable.Using my K factor, I started to run through the match history of each team. As I mentioned before, I gave every team an equal start at 1500 elo, it was up to them to raise or lower their rating. One thing to keep in mind, around summer 2016 games were handled differently. Instead of one game, LoL switched to best of 5. There were two ways to approach this you could update elo based on who won the set or based on individual games. I decided to update based on individual games as a 3-0 win is more telling of who is better than a close 3-2 win.Nate Silver uses game scores, home court advantage, and margins of victory in his elo calculations. LoL is different as their are no “home courts” as it is an online game. There is no game score or easily measurable margin of victory or point spread. There are W’s and L’s. As Dustin Pedroia is quoted saying in Nate Silver’s book “All I care about is W’s and L’s.” So my elo calc is simple it only cares about who won and who lost. Maybe down the line that will change, maybe after I compare the results of the spring playoffs to my predictions. After all these calcs and all there games were run I had elo for every team.Finally using the elo calculated after two years of games, less for more recent LCS teams (looking at you FLY), I could probabilistically determine the outcome of any match up. My mind immediately went to my favorite statistical hammer: Monte Carlo simulation. If you have read my previous posts I have used monte carlo simulation here and here. 50,000 simulations of the spring 2017 playoffs later, I produced the bracket you see below. As you can see teams like TSM and C9 have high chances of placing due to their high elo and 1st week bys. Teams like Dignitas and FLY have much lower chances (especially dig) at claiming the title. However their chance is based upon building momentum. After each game of the tournament elo is recalculated. If a team like Dig 3-0s a higher seeded team their elo is boosted to a point where they have a better chance against a high elo team like TSM.I’ll update my predictions after each stage of the tourney. I am excited to see if my predictions were close or not.GO TSM!-Marcello