Complete History of The NALCS

Data is current up to: Spring Playoffs 2017

My 
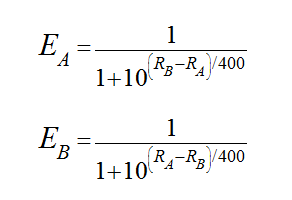
previous post got me thinking. How does every team in that has ever participated in the North American League of Legends Championship Series (NALCS) stack up? For sports like chess, football, soccer, baseball, and many others an ELO based system is used to rank teams.

Elo is a straightforward calculation and concept. If a team wins their rank should go up, if a team loses their rank should go down. How much these teams rise or fall is based upon their expectation of winning the game. A team that is mathematically favorited to win a game will rise slowly, but fall sharply if they lose. Conversely, a team that is not favored to win will fall slowly, but in the case of an upset will rise sharply. Using this concept, pioneered in sports of all types by 538, and applying it to League of Legends an online-only video game gives us insight into the …ahem … league.

Inspired by the fantastic visualization 538 did with their “Complete History of the NBA”, I set out to build a similar visualization for the NALCS. First, as all these projects go, I needed data. Unfortunately for me, there was no ready made database with all the info I needed. My first priority was to put together a database with W’s, L’s, and teams. League of Legends has a massive following and because of this has pretty good records. Leaguepedia provided me with all the information I needed. I scraped all their NALCS match data, tidied it up, and built my database. This became the backbone for my ELO calculation.

Calculating Elo is a simple process. I outlined it in my last post which is worth a read. Once all elo’s were calculated I started building my visualization. The above visualization was made in D3.js. I started by using Nate Miller’s block and then modified it like crazy to make it do everything I needed. The visualization starts with the Spring 2013 split. If you are familiar with LoL, this is actually the 3rd year in the championship season, but the first officially recognized by Riot Games the maker of LoL. This felt like a natural place to start.  Here are a few interesting teams from the history of the NALCS.

TEAM SOLO MID: THE BEST TEAM THE NALCS HAS EVER SEEN

TSM

Team SoloMid (TSM) has been around as long as competitive League of Legends has existed. They have participated in every single season and almost every single playoff. They are a force to be reckoned with. Ending the Summer 2016 split with a 17-1 record and a decisive playoff title, TSM cemented themselves as the greatest team in the the history of NALCS.

CLOUD 9:  A GAME AWAY FROM GREATNESS

C9

Every great team has a great rival. Baseball had Yankees/Red Sox, League of Legends has TSM/Cloud 9 (C9). Cloud 9 only started one season after TSM, but quickly rose to be the best team the NALCS had seen. However after a string of losses, C9 began their fall.  C9’s top position was taken by one game 3 years later by TSM.

TEAM COAST: THE WORST TEAM THE NALCS HAS EVER SEEN

C

If TSM represents the best NALCS has to offer, Team Coast is the worst. Originally known as Good Game University (seen above in red), changed their name to Team Coast on June 1,2013. Coast never had a good record. The final nail in the coffin was Spring split 2015 where team Coast achieved an embarrassing 1-17 record, one of the worst records NALCS has seen.

DIGNITAS: MOST DECIDEDLY AVERAGE TEAM

DIG

Now this one hurt. I have been a Dignitas fan since the early days of imaqtpie. Time and the NALCS has not been kind to Dig. They are one of the original LoL teams but they cannot seem to escape mediocrity. Their elo never swung more than 80 points outside average, even though they lost their spot in the NALCS in Summer 2016.

ECHOFOX: TEAM OF MANY NAMES

Echofox

In League teams rarely vanish completely, most get acquired, absorbed, or renamed. Echo Fox went through three name changes throughout their professional run. Originally Echo Fox was Curse Academy the challenger (think semi-pro) arm of the Curse brand. Curse Academy itself was a renaming of “Children of IWDominate”. They renamed after qualifying for Season three of the challenger league. Curse Academy rebranded themselves to Gravity Gaming after Riot’s new sponsorship rules involving the Curse voice chat client and their team by the same name. Finally on December 18th, 2015, Gravity Gaming was bought by Rick Fox of NBA fame and renamed to Echo Fox. The name changes have not helped their Elo.

IMMORTALS: FROM HUMBLE BEGINNINGS

IMT

As a relative newcomer to the NALCS, Immortals have done well for themselves. Originally Team 8, Immortals have surpassed an exceed T8’s skill. T8 was a mediocre team, not straying far from average. However, with a new name, and more importantly a new roster, Immortals reached a peak elo of 1760, before taking 3rd place in the 2016 Summer split.

50,000 LCS 2017 SPRING PLAYOFFS – Postmortem

lol

In my last blog post,  I ran 50,000 monte-carlo simulations of all the possible outcomes for the Spring 2017 NALCS playoffs. For those of you who are not familiar with NALCS and LoL, League of Legends (LoL) is an online competitive video game that draws massive attention. The NALCS is the professional LoL series in North America. Every spring, after the spring season games are done, 6 teams enter playoffs.  These teams compete in best of 5 matches, single elimination.

Using a modified elo calculation, I ranked all the teams entering the spring playoffs based on their past performance. With their elo “ranks”, I pit each team against each other 50,000 times and recorded the final brackets. I then compiled all these brackets and calculated percentages of winning for each team. My simulation yielded the following bracket:

lol

My simulations predicted that first round Phoenix1 would decisively win over Dignitas and Counter Logic Gaming would have a hard fought win over Flyquest. Round two would have Team SoloMid would trounce anyone who made it past the first round, Cloud9 would treat their opponents similarly. Third place would be very dependent on the losers of round 2, but Pheonix1  seems to be a solid choice for third place. Last for the finals of the playoffs, Team SoloMid should take the crown, but not without a fight from Cloud9. So if we were betting on the trifecta, Third place: Phoenix, Second place: Cloud9, and Champion: Team SoloMid.

Now for the results.

Screen Shot 2017-08-20 at 6.52.12 PM

If I was a betting man, I could’ve won some money.  Good news: I predicted the trifecta, bad news: we got one wrong. Luckily for us, the one we got wrong was an incredibly tight match up and it went to game 5.

Things we got right: Phoenix 1 demolished Team Dignitas 3-0. Team SoloMid trounced FlyQuest 3-0 as well. Cloud 9 also did very well against Phoenix 1 winning 3-0. The third place match was quite tight, but Phoenix1 took it in game 5. From my predictions, I had Phoenix1 taking third, but I did not believe it would be so close. The final also went to game 5. Team SoloMid had a slight edge, enough to take the championship in the end.

Things we got wrong: CLG vs FlyQuest. I had CLG narrowly winning this game, unfortunately FlyQuest came ahead.  I predicted this match up to be very close. My prediction was looking good at the beginning of the series. CLG took the first two games, but FlyQuest rallied and took the last 3 in a row.

Overall I believe the simulations were a success. 5/6 games predicted correctly with the trifecta.

Stay tuned for more esports predictions.

-Marcello

Posted in

50,000 Simulations of League of Legends 2017 Spring Playoffs

header

Team SoloMid is going to win the Spring 2017 Playoffs. Cloud 9 will most likely take 2nd place and Phoenix1 will probably settle into third place. This is not a guess based on seeds (even though it seems to work out that way). This prediction is based on 50,000 simulations I ran of the playoffs to determine the most probable bracket.

Before we get into the simulations, for those of you who do not play online video games. League of Legends by Riot Games is the most popular online multiplayer game. League of Legends or LoL is a multiplayer online battle arena (MOBA) type game. This game has become so huge that people have it has become its own sport or esport. There are professionals that play for a living. With professional players comes sanctioned tournaments. Tomorrow starts the spring 2017 north american (NA) League of Legends Championship Series (LCS). Six professional LoL teams will compete for the top spot and a cash prize. I wanted to see if I could predict the winner.

Screen Shot 2017-04-07 at 10.07.52 PM

The schedule and teams

However, simulating a tournament is not as easy as flipping a coin for each match up. The data generated needs to have weight; it needs to be significant, and most importantly needs to model real life. In order to give weight to my simulations I needed to determine which team was going to win each match up probabilistically.

In theory, in any match up the team with the higher skill should beat the team with the lower skill more times than not. The best way to quantify this is to calculate an elo, which ideally represents a team’s skill. Elo is used in many online multiplayer games to determine a player’s skill. Elo originated in the chess scene. Named after the creator, Arpad Elo, Elo was used to determine the top players based on who they competed against. Elo has been expanded to many other sports and games. Most notably, Nate Silver and his team at 538 have been using elo for all types of sports. The have built elo models for football and basketball as well as baseball. However, you need match history and other data to build an accurate elo for a team or player.

I scraped two years of professional game results, around 700 games. Each team in those two years started with an elo of 1500. As teams competed against each other, elo fell rose, and stabilized. The method for calculating elo is easy the formula is quite straight forward (check out this tutorial here). You need a few things to calculate elo: the rating of both teams before the match, the outcome of the match, and a “k factor”.

ELO_2

Formulas for calculating Elo ratings

Ratings and Outcomes are handled by the data and the equations above, however, the “K factor” must be estimated. I tried out a few k factors to determine which provided the most stable, but reactive elos and settled on a value of 20. I looked to a lot of Nate Silver/538 to see if they had any inside. I highly suggest reading how they calculate their elo values as the insight was invaluable.

Using my K factor, I started to run through the match history of each team. As I mentioned before, I gave every team an equal start at 1500 elo, it was up to them to raise or lower their rating. One thing to keep in mind, around summer 2016 games were handled differently. Instead of one game, LoL switched to best of 5. There were two ways to approach this you could update elo based on who won the set or based on individual games. I decided to update based on individual games as a 3-0 win is more telling of who is better than a close 3-2 win.

Nate Silver uses game scores, home court advantage, and margins of victory in  his elo calculations. LoL is different as their are no “home courts” as it is an online game. There is no game score or easily measurable margin of victory or point spread. There are W’s and L’s. As Dustin Pedroia is quoted saying in Nate Silver’s book “All I care about is W’s and L’s.” So my elo calc is simple it only cares about who won and who lost. Maybe down the line that will change, maybe after I compare the results of the spring playoffs to my predictions. After all these calcs and all there games were run I had elo for every team.

Finally using the elo calculated after two years of games, less for more recent LCS teams (looking at you FLY), I could probabilistically determine the outcome of any match up. My mind immediately went to my favorite statistical hammer: Monte Carlo simulation. If you have read my previous posts I have used monte carlo simulation here and here. 50,000 simulations of the spring 2017 playoffs later, I produced the bracket you see below.

lol

As you can see teams like TSM and C9 have high chances of placing due to their high elo and 1st week bys. Teams like Dignitas and FLY have much lower chances (especially dig) at claiming the title. However their chance is based upon building momentum. After each game of the tournament elo is recalculated. If a team like Dig 3-0s a higher seeded team their elo is boosted to a point where they have a better chance against a high elo team like TSM.

I’ll update my predictions after each stage of the tourney. I am excited to see if my predictions were close or not.

GO TSM!

-Marcello

Kingdom Death: Monster Fight Optimization

Diary-of-Death-Header-1


After another round of Kingdom Death: Monster, I found that the weapon optimization tool I built in my last post here was invaluable. However, it was missing one thing. How does each weapon fit into a team composition?


In KDM, whenever you go out to hunt a monster (or whenever you are hunted by a monster) you can take up to 4 survivors to try to slay your query. Each survivor can be equipped with a weapon which helps them wound the monster. Survivors can also forgo a weapon and opt to fight the monster “fist and tooth.”


As I mentioned in my previous post, each weapon brings its own stats to the table. I was interested in how different combinations would affect the outcome of each battle. Would equipping a team with four bone blades be better or worse than equipping a team with only their fists and one bone axe?


The shiny app below allows you determine which team comp is better. You first select your monster, then your weapons for team a, then your weapons for team b. Hit the go button and 1000 hunts of your monster with your selected weapons are ran and compared. The simulations take anywhere from 30 seconds to 2 minutes (there’s a lot of sword swinging and arrow slinging going on behind the scenes).


At the end of the 1000 battles, four graphs should be produced. the top left graph shows the number of turns it took to slay the monster. Top right shows how many times you hit the monster, but may not have wound the monster (more in depth explanation of how attacking works in KDM here). Bottom left shows the wounds inflicted on the monster. Bottom right shows how many times you may have critically wounded the monster.


These graphs let you take a peek at how the distributions look for both of the team compositions you selected. For hard statistics, click on the second tab. This allows you to compare teams via averages and standard deviations on key attributes.


Hope this helps you ease the blow of future KDM campaigns


Happy Hunting,
– Marcello
Posted in

Kingdom Death: Monster Weapon Optimization

Kingdom-Death-Monster-Header

A few buddies of mine started playing a new game: Kingdom Death: Monster. KDM is a table top rpg-like game where you go out to hunt monsters and manage a settlement. We all got deeply involved equipping our characters and deciding their fates. One point of contention amongst the group was which weapons we should equip our squad with.

Each weapon has perks and drawbacks so it makes it difficult to determine if there is such at thing as a “best” weapon for your characters. Each weapon has three major attributes, strength, accuracy, and speed.

Strength determines how hard the weapon hits, accuracy determines how easy it is to hit with the weapon, and speed determines how many attacks you can get off with the weapon in a single turn. There is usually a trade off between these three stats. A weapon with high strength might have low speed because it is heavy or hard to use. A quick weapon might provide the opportunity for multiple hits, but might be less accurate than another option.

All of these options have to be weighed against the monster you plan to hunt. Each monster has different attributes making weapon choice important. Some monsters are harder to hit, others have a tough hide that requires more strength to break through.  So keeping this in mind how do we choose the best weapon?

dice

Like most table top games and rpgs all actions the player takes are determined by dice rolls whether they succeed or fail. When a player wants to attack a monster she rolls a dice and the number will tell her whether she hits the monster or not. Simulating actions this way allows to mathematically determine outcome much easier as I just have to model a dice roll for each attack.

Before we go into simulation, I should clearly outline the process of attacking a monster in KDM. KDM takes a unique approach on attacking a monster. There are two main stages to an attack: hit phase and wound phase.

During hit phase the player rolls to see if they actually hit the monster. They look at the monster’s evasion stat and their weapon’s accuracy stat. In order to hit the player must roll higher than their weapon’s accuracy stat plus the monster’s evasion stat. For each point of speed the weapon has the player may roll one dice. For example if their sword has a speed of 3, they can roll up to three dice.

Once the player determines if they hit or not they go to the next phase: wound phase. Here the play rolls again to see if they wound the monster. They re roll any dice that was greater than their weapon’s accuracy stat plus the monster’s evasion stat from the previous phase. To actually wound the monster, the player must roll higher than the monster’s toughness (or hide) minus the strength of the weapon.  Every dice that passes this check wounds the monster.

Every roll is done on a 10-sided die. However, in KDM there are two special rolls, 1 and 10. Whenever a player rolls a 1, the hit or the wound fails no exception. Whenever a player rolls a 10, the hit or wound succeeds no exception.

phe

In order to quantify which weapon performs better against certain monsters, I will need to determine the probabilities of hitting and more importantly wounding the monster. This could probably be done with distributions and simple probabilities, however, with the 1/10 rule and the various strength and accuracy check I decided on a different approach. In comes Monte Carlo methods.

Monte Carlo methods simulate your problem multiple times to determine probabilities of success. Essential to the method is randomness. Each trial produces a different result and if the number of trials is decently large it begins to model the distribution of the initial problem. I stumbled upon a great blog post that outlines how to perform these methods using R.

The website Count Bayesie outlines different ways to use Monte Carlo methods here. I highly recommend reading the post as it outlines MC methods pretty clearly and gives real world examples with easy to follow code.

Using R, I created a script that would crunch the numbers on each weapon. The script calculates the chance to hit, wound, critical hit, and critical wound (happens when a 10 is rolled). The script will also plot the distributions of each stat and compare them to another weapon.  All of the above depends on the monster. Each monster has 3 levels with various stats.

The script initially produced tables and graphs, but wasn’t super useful. I converted the script into a shiny webapp below. Now anyone can utilize my monte carlo script to compare any two weapons for any given monster.

There are a few limitations so far. You can only compare 2 weapons at a time. Weapon special abilities are not taken into account. This means that weapons are only compared on base stats only.

The weapon simulator has been updated! It now includes all weapon “perks” and affinities. Try it for yourself! (Gaxe is a good option as the affinities add +1 speed)

Enjoy!

-Marcello

Posted in