Campaign finances are becoming a prominent issue in today’s elections. We have candidates like Jeb Bush who are receiving record breaking amounts of donations from private citizens and private companies alike. On the other hand we have candidates like Bernie Sanders who only receives small donations from citizens. Regardless of your opinion on which end of the spectrum candidates should behave toward campaign donations, they are nevertheless an important part of US elections. When discussing campaign donations it is almost always about presidential candidates, but what about our legislators. They only time I ever heard about donations to legislators is when there is a huge scandal. Do they pull in as much money as presidential candidates? Do they receive more money from the average citizen or the average corporation? Do legislators of a certain party pull in more than another?
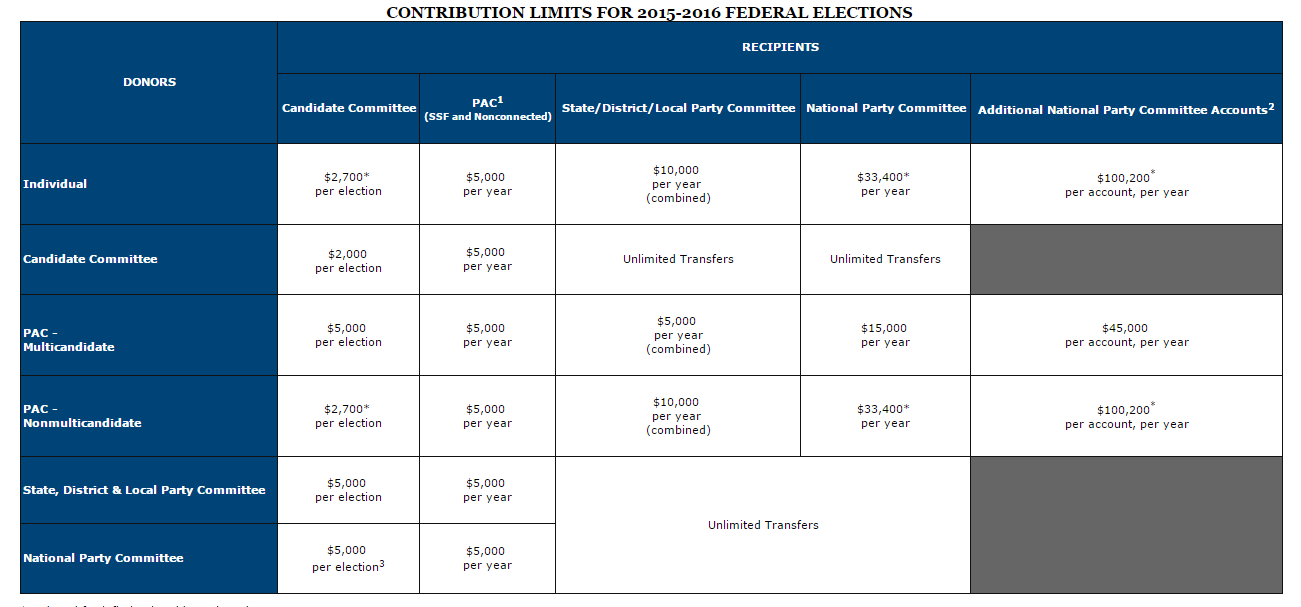
To achieve this I needed data on campaign donations for all the federal legislators. Luckily for me I am not the first to look for this data. There are quite a few places to go to for this information, but I wanted a place with an easy to understand API and something reliable. This led me to followthemoney.org. Here there is a very soft “API”, but nevertheless super useful and easy to parse. I took the data for all legislators from the past 5 years for any candidate that ran for either the Senate or the House of Representatives. Using their API, I exported their data in csv format. From there the preprocessing and the analysis was all preformed in python (anaconda distribution).Before we jump into the analysis we need to know a little more about campaign contributions themselves. There are federal contribution limits imposed to limit how much people (and corporations, parties, PACS, etc..) can donate. There are a few ways to get around these limits however and recent legislature that has helped to facilitate that.

The two recent major decisions that we need to know for analysis are McCutcheon v. FEC and Citizens united v. FEC. Both of these decisions deal with how much people can contribute to candidates. Citizens United v. FEC
[1] prohibited the government from restricting political expenditures by a non-profit organization. This however is subtly different than direct campaign donations, this type of expenditure
[2] endorses the candidate but is made independently from the candidate. This we have to keep in mind when discussing PACs, as this is a heavily used tactic to funnel large sums of money into a candidate. The other decision was McCutcheon v. FEC
[3], this decision removed the aggregate limits on campaign contributions. These decisions have brought in new spending and new ways to spend. It is more important
STATE OF THE UNIONNow that we know who can donate and how much they can donate, let’s see who is on the receiving end. One more important thing we need to know is when all of our candidates are up for election. As we all know Senators serve a total of six years, with 1/3 of the Senate up for reelection every two years. Congressmen on the other hand only serve two years and are up for election every two years. Elections fall on the even numbered years, so our important data will fall on 2010, 2012, and 2014. All other years are reserved for special elections, like if a senator dies midterm. For this first part I am using the data from the 2014 elections.In 2014, the average Senator/Congressman pulled in a little over a million dollars in campaign donations. This average is a little skewed as some legislators pulled under a thousand and some over 10 million. The range of the campaign donations is set by these two men, Mitch McConnell and John Patrick Devine. Mitch McConnel, a republican and more importantly the Majority leader of the Senate, pulled in a whooping $30 million, while John Patrick (whose googling revealed no pertinent results) pulled in a less than stellar $40. Naturally, John Patrick lost his race, while Mitch McConnel is our current majority leader and has held his office in the senate since 1985.

Speaking of winners and losers, who makes more? Naturally, I believe that the average winner should pull in a great deal more than the average loser. And well, that’s pretty much how it goes. Winners bring in an average of $2 million while losers can only muster up about half a mill. This is however, excluding a group of politicians who chose to withdraw from the race. Looking at those politicians they close the gap, but not by much they pull in half of that as winner, $1 million.

Before we dive into state by state trends lets see how the Senate do against the house of reps. Below the graph sums up this subsection.

The House pulls in a lot more donations than the Senate. However, this may be due to the sheer amount of people that run for the House. This brings us to a good point. Donations are heavily influenced by the amount of people who run and the amount of people who donate. To avoid making everything based simply on population rather than underlying trends. Most of the following graphs will be averages or per capita when necessary.Keeping that in mind, let’s see how all 50 states line up. Below is a graph on donations per capita.

That’s much better. As you can see this is obviously not a population map. States like NY, NJ, MA, and CA are not top tier, but rather toward the bottom. Interestingly enough, states that have less people in them seem to have much greater donations per person, Alaska is a notable example. Why do these states get way more contributions than others? One possible explanation are that some of theses states are swing states. Swing states (like New Hampshire above) are very closely divided between the Republicans and the Democrats. These states should naturally garnish more donations as the races should be more exciting and volatile. In coarser terms, campaign money is more valuable in these states.
Before we go any further, we have to go into whose donating, lets take a look nationwide as to who is donating the most. Is it mostly large sums, or small donations?
PEOPLE, PACS, AND THINGSSpeaking of small donations, who actually donates to campaigns? I personally have never, my naïve and uninformed idea of campaign donations are just giant faceless corporations throwing money at candidates. Let’s take a peek at average joes like you and me and how much they spend. Below you can see two maps of the US, one for 2012 and one for 2014. Hover over each state to see which citizen donated the most and how much they donated, the color scale lets you compare states to each other.
These two maps display the top donators for each state in 2012 and 2014. As you can see in 2012 Texas and Connecticut dominated in terms of individual donators. These points may have skewed the data however, as Linda from Connecticut was actually running in the campaign herself, personally funding her run. David from Texas was the lieutenant governor of Texas during that time. These do not seem like ordinary people.
2014 paints a more familiar (and relate-able) campaign. The donations are much lower than in 2012, but similar trends emerge. New York, California and Texas are all toward the top in terms of individual donators. With “fly-over” states toward the bottom.
Now what about those big faceless corporations. Here are two more maps, however these are only for the year 2014. The map on the left shows the the top Industry for that state the chart on the right shows the top ten Industries that donate the most nationwide.
Again we have what looks to be a population map. It seems like states with the most people have the highest individual donators whether from citizens or corporations. One thing that stood out to me were the biggest donors. Real estate and medical professionals we the top players in most states. Much less surprising was that Oil & Gas donated the most where, you guessed it, there is Oil & Gas.
Finally, what about groups who donate based on different ideology? Some examples of these groups are pro-Israel, Pro-Life/Pro-Choice, environmental policy as well as many others. The bar chart on the left shows a nationwide average of which ideologies get the most money. The map on the left shows the most popular ideology per state.
Unfortunately the way followthemoney.org structures its data makes looking at ideologies a little boring. General Liberal and Conservative ideologies are grouped. Obviously these dominate nationwide. However, there are some other ideologies that creep up after these two power houses. Big issues like Foreign policy and environment garner some money. These ideologies do not nearly donate as much as some of the smaller industries. Excluding Liberal and Conservative, ideologies donate ten fold less than industries.
PARTY FOULSo far we have skipped over the two most important groups in American politics, the Republicans and the Democrats. How do the parties compare? Seeing that the country is pretty divided on party allegiance I’d expect donations to each party be relatively the same. One thing I’d also expect is that third party candidates don’t pull in even the same magnitude as the two major parties.

Well that seems about right. Democrats and Republicans pull in around the same amount each year, while third party candidates are not even close. This was to be expected as third-party candidates rarely have the same pull nor presence as candidates from the two major parties.Now what about statewide. During presidential elections most states are glazed over. This is because they are usually deeply entrenched in one party of the other. Below is a map of which party got each states electoral votes. Next to that is which party got more money in the 2014 elections.

from: Politico.com
The first graph from Politico shows which party each state voted for. The one below is which party received more donation in each state. The two maps look quite similar. Both the east and west coast mirror each other to an extent. The midwest also aligns with donations. Donations to legislators in each state may be a good predictor into where the electoral votes end up. Or, more possibly, states that were going to vote for a certain party donate to that party more.
Some states receive a lot more attention than other when it comes time for presidential elections. Currently I am only looking at federal legislator’s donations, but I wonder if they reflect presidential politics as well. Certain states I will refer to as swing states. These states are not as deeply entrenched as others. The swing states for 2014 were: Nevada, Colorado, Iowa, Wisconsin, Ohio, New Hampshire, Virginia, North Carolina, and Florida. The map below highlights states that have the closest spending between the Democrats and the Republicans.

Most of the swing states have very similar donations between the two parties. Swing states like Virginia, Florida, and Nevada have very close donations totals. Virginia actually has the closest out of all of the states. On the other end, states like California, Texas, and New York have the greatest difference in donations. This makes sense as these states are deeply entrenched in one party, just look at Texas the donations are completely lopsided. There is some good news in this map. Most states are relatively close when it comes to donations to both parties.
MONEY MONEY MONEY MONEYPolitical Donations are a critical component of the United States government. Looking at the donations many of my previous assumptions were confirmed and many were discredited. However, one must have a critical eye on the data presented. The analysis is only as good as the data collected. I believe it is integral to have reliable and vetted donation data as it holds many insights. I’d like to thank followthemoney.org for their data and commitment. If you liked this analysis please check out their website and explore the data yourself! Maybe even consider donating! -Marcello
[1] https://en.wikipedia.org/wiki/Citizens_United_v._FEC
[2] https://en.wikipedia.org/wiki/Independent_expenditure
[3] https://en.wikipedia.org/wiki/McCutcheon_v._FEC
 Team SoloMid (TSM) has been around as long as competitive League of Legends has existed. They have participated in every single season and almost every single playoff. They are a force to be reckoned with. Ending the Summer 2016 split with a 17-1 record and a decisive playoff title, TSM cemented themselves as the greatest team in the the history of NALCS.CLOUD 9: A GAME AWAY FROM GREATNESS
 Every great team has a great rival. Baseball had Yankees/Red Sox, League of Legends has TSM/Cloud 9 (C9). Cloud 9 only started one season after TSM, but quickly rose to be the best team the NALCS had seen. However after a string of losses, C9 began their fall. C9’s top position was taken by one game 3 years later by TSM.TEAM COAST: THE WORST TEAM THE NALCS HAS EVER SEEN
 If TSM represents the best NALCS has to offer, Team Coast is the worst. Originally known as Good Game University (seen above in red), changed their name to Team Coast on June 1,2013. Coast never had a good record. The final nail in the coffin was Spring split 2015 where team Coast achieved an embarrassing 1-17 record, one of the worst records NALCS has seen.DIGNITAS: MOST DECIDEDLY AVERAGE TEAM
 Now this one hurt. I have been a Dignitas fan since the early days of imaqtpie. Time and the NALCS has not been kind to Dig. They are one of the original LoL teams but they cannot seem to escape mediocrity. Their elo never swung more than 80 points outside average, even though they lost their spot in the NALCS in Summer 2016.ECHOFOX: TEAM OF MANY NAMES
 In League teams rarely vanish completely, most get acquired, absorbed, or renamed. Echo Fox went through three name changes throughout their professional run. Originally Echo Fox was Curse Academy the challenger (think semi-pro) arm of the Curse brand. Curse Academy itself was a renaming of “Children of IWDominate”. They renamed after qualifying for Season three of the challenger league. Curse Academy rebranded themselves to Gravity Gaming after Riot’s new sponsorship rules involving the Curse voice chat client and their team by the same name. Finally on December 18th, 2015, Gravity Gaming was bought by Rick Fox of NBA fame and renamed to Echo Fox. The name changes have not helped their Elo.IMMORTALS: FROM HUMBLE BEGINNINGS
 As a relative newcomer to the NALCS, Immortals have done well for themselves. Originally Team 8, Immortals have surpassed an exceed T8’s skill. T8 was a mediocre team, not straying far from average. However, with a new name, and more importantly a new roster, Immortals reached a peak elo of 1760, before taking 3rd place in the 2016 Summer split.